Quando scopri le criptovalute, come ad esempio il Bitcoin, realizzi velocemente che non c’è un singolo prezzo per i bitcoin in un dato momento. La ragione è che i bitcoin vengono venduti su mercati differenti. Può essere fruttuoso l’acquisto sull’exchange coinbase piuttosto che su kraken. In particolare, il prezzo di coindesk del bitcoin mira a unificare il prezzo del bitcoin in un singolo numero basato su 4 mercati che rispettano determinati criteri. In pratica, l’uso di un indice per la criptovaluta sembra essere più utile per la stampa e i giornali, piuttosto che per gli investitori. Che di solito controllano l’exchange dove sono aperte le loro posizioni e tengono nota dei prezzi relativi agli exchange. L’idea di vendere la stessa criptovaluta su differenti cripto mercati allo stesso tempo non è nuova.
E’ come vendere 2 azioni i cui prezzi sono molto simili e cointegrati ed è conosciuto come arbitraggio statistico. L’arbitraggio statistico base è una strategia di trading che prevede che i prezzi di 2 azioni non siano stazionari ossia che cambiano nel tempo. In altre parole quando una moneta supera l’altra, la moneta che vale meno viene lasciata a lungo con la previsione che risalirà rispetto all’altra, mentre quest’ultima viene venduta velocemente. In questo articolo vedremo come combinare la teoria con i veri dati di mercato, come identificare le opportunità di arbitraggio statistico per comprare e vendere, creeremo un semplice test in Python dove potrai verificare che l’arbitraggio non sia fallimentare, e che invece sia profittevole. Iniziamo quindi: Arbitraggio crypto con Python.
Individuare i mercati dove viene venduta una data criptovaluta | Arbitraggio crypto con Python
La costruzione di un algoritmo di trading basato su statistiche arbitrarie inizia con la costruzione delle tue conoscenze sui dati disponibili. La prima cosa che devi sapere sono i nomi dei cripto mercati dove vengono vendute le criptovalute. Pensiamo ad esempio che siamo interessati a vendere ether, o più precisamente, ETH/USD.
Utilizzeremo l’API di criptocomapre.com che insieme a Python può darci le informazioni di cui abbiamo bisogno.
import numpy as np

import pandas as pd

from scipy import stats

from matplotlib import pyplot as plt

from datetime import datetime

import json

from bs4 import BeautifulSoup

import requests


%matplotlib inline

grey = .6, .6, .6


# define a pair

fsym = "ETH"

tsym = "USD"


url = "https://www.cryptocompare.com/api/data/coinsnapshot/?fsym=" + \

fsym + "&tsym=" + tsym

response = requests.get(url)

soup = BeautifulSoup(response.content, "html.parser")

dic = json.loads(soup.prettify())

print(dic)
Qui su andiamo a prendere un’istantanea della coin (ETH/USD) che dà dei dati in formato JSON che andiamo ad utilizzare in un dizionario di Python, dic. A prima vista la variabille dic contiene una grande quantità di informazioni:
{'Data': {'AggregatedData': {'FLAGS': '4',

'FROMSYMBOL': 'ETH',

'HIGH24HOUR': '301.14',

'HIGHDAY': '300.65',

'LASTMARKET': 'Exmo',

'LASTTRADEID': '24442414',

'LASTUPDATE': '1509915676',

'LASTVOLUME': '0.00212',

'LASTVOLUMETO': '0.61979896',

'LOW24HOUR': '294.59',

'LOWDAY': '295.2',

'MARKET': 'CCCAGG',

'OPEN24HOUR': '297.85',

'OPENDAY': '300.04',

'PRICE': '296.8',

'TOSYMBOL': 'USD',

'TYPE': '5',

'VOLUME24HOUR': '206617.29367793005',

'VOLUME24HOURTO': '61511364.75962282',

'VOLUMEDAY': '181568.2062645673',

'VOLUMEDAYTO': '53913839.277825184'},

'Algorithm': 'Ethash',

'BlockNumber': 4497207,

'BlockReward': 3.0,

'Exchanges': [{'FLAGS': '1',

'FROMSYMBOL': 'ETH',

'HIGH24HOUR': '305.45',

'LASTTRADEID': '1060368',

'LASTUPDATE': '1509915610',

'LASTVOLUME': '0.027127',

'LASTVOLUMETO': '8.23982625',

'LOW24HOUR': '301.04300027',

'MARKET': 'Cexio',

'OPEN24HOUR': '301.66699999',

'PRICE': '303.75',

'TOSYMBOL': 'USD',

'TYPE': '2',

'VOLUME24HOUR': '2053.973031999999',

'VOLUME24HOURTO': '622022.5332660044'},

{'FLAGS': '1',

'FROMSYMBOL': 'ETH',

'HIGH24HOUR': '302',

'LASTTRADEID': '14074021',

'LASTUPDATE': '1509915662',

'LASTVOLUME': '0.00003349',

'LASTVOLUMETO': '0.0099672938',

'LOW24HOUR': '296',

'MARKET': 'Coinbase',

'OPEN24HOUR': '298.75',

'PRICE': '297.62',

'TOSYMBOL': 'USD',

'TYPE': '2',

'VOLUME24HOUR': '48653.64503668011',

'VOLUME24HOURTO': '14517318.477630273'},
Per l’obbietto che vogliamo raggiungere, puntiamo solo ad estrarre i nomi di tutti gli exchange dove si trovano ETH/USD:
market = []

d = dic['Data']['Exchanges']  # a list

for i in range(len(d)):

market.append(d[i]['MARKET'])

print(market[-1])
Cexio
Coinbase
Coinroom
Gemini
Bitfinex
Cryptsy
Tidex
CCEX
Gatecoin
BTCE
Kraken
OKCoin
Exmo
WavesDEX
BitTrex
Remitano
Poloniex
HitBTC
Lykke
BitBay
LiveCoin
Yobit
Quoine
Exchange divisi secondo il volume scambiato nelle ultime 24 ore | Arbitraggio crypto con Python
Che mercato dovremmo scegliere per utilizzare la nostra strategia di trading arbitrario? Può essere scelto filtrando i dati di mercato secondo il volume scambiato più alto nelle ultime 24 ore. Se c’è un interesse maggiore in uno specifico mercato possiamo eliminare il rischio della liquidità e garantire tempi di esecuzione più veloci.
Su python andiamo ad usare un metodo speciale (linea 43) per filtrare la lista e ottenere i risultati desiderati:
vol = []

d = dic['Data']['Exchanges']  # a list

for i in range(len(d)):

vol.append([d[i]['MARKET'], round(float(d[i]['VOLUME24HOUR']),2)])


# sort a list of sublists according to 2nd item in a sublist

vol = sorted(vol, key=lambda x: -x[1])


# Cryptocurrency Markets according to Volume traded within last 24 hours

for e in vol:

print("%10s%15.2f" % (e[0], e[1]))


Bitfinex       99874.91

Coinbase       48653.65

HitBTC       20080.36

Poloniex       11928.00

Gemini        7676.25

Kraken        7354.39

BitTrex        5720.76

Cexio        2053.97

Exmo        1621.00

Quoine         963.88

OKCoin         424.38

Lykke         162.65

Yobit         124.61

Tidex         117.18

LiveCoin          61.12

CCEX          37.04

Remitano           1.70

Gatecoin           1.19

Coinroom           0.78

Cryptsy           0.00

BTCE           0.00

WavesDEX           0.00

BitBay           0.00
Andiamo a selezionare i 10 migliori mercati di trading per ETH/USD:
# Select Top 10 Cryptocurrency Markets

markets = [e[0] for e in vol][0:10]

print(markets)


['Bitfinex',

'Coinbase',

'HitBTC',

'Poloniex',

'Gemini',

'Kraken',

'BitTrex',

'Cexio',

'Exmo',

'Quoine']
Tieni a mente che l’ordine della lista potrebbe cambiare se si usa lo script in un giorno differente.
Scaricare i registri di prezzo delle crypto di uno specifico exchange | Arbitraggio crypto con Python
In questo modo possiamo specificare il mercato da cui vogliamo scaricare i registri di prezzo della valuta:
def fetchCryptoOHLC_byExchange(fsym, tsym, exchange):

# a function fetches a crypto OHLC price-series for fsym/tsym and stores

# it in a pandas DataFrame; uses specific Exchange as provided

# src: https://www.cryptocompare.com/api/


cols = ['date', 'timestamp', 'open', 'high', 'low', 'close']

lst = ['time', 'open', 'high', 'low', 'close']


timestamp_today = datetime.today().timestamp()

curr_timestamp = timestamp_today


for j in range(2):

df = pd.DataFrame(columns=cols)

url = "https://min-api.cryptocompare.com/data/histoday?fsym=" + fsym + \

"&tsym=" + tsym + "&toTs=" + str(int(curr_timestamp)) + \

"&limit=2000" + "&e=" + exchange

response = requests.get(url)

soup = BeautifulSoup(response.content, "html.parser")

dic = json.loads(soup.prettify())


for i in range(1, 2001):

tmp = []

for e in enumerate(lst):

x = e[0]

y = dic['Data'][i][e[1]]

if(x == 0):

# timestamp-to-date

td = datetime.fromtimestamp(int(y)).strftime('%Y-%m-%d')

tmp.append(td)  #(str(timestamp2date(y)))

tmp.append(y)

if(np.sum(tmp[-4::]) > 0):

df.loc[len(df)] = np.array(tmp)

df.index = pd.to_datetime(df.date)

df.drop('date', axis=1, inplace=True)

curr_timestamp = int(df.iloc[0][0])


if(j == 0):

df0 = df.copy()

else:

data = pd.concat([df, df0], axis=0)


return data.astype(np.float64)
Adesso andiamo a scrivere il codice che ci permette non solo di scaricare il registro ma anche di metterlo in dataframe.
# if a variable 'cp' exists, delete it

if ('cp' in globals()) or ('cp' in locals()): del cp


# download daily OHLC price-series for ETH/USD for a given 'market'

# extract close-price (cp)


print("%s/%s" % (fsym, tsym))

for market in markets:

print("%12s... " % market, end="")

df = fetchCryptoOHLC_byExchange(fsym, tsym, market)

ts = df[(df.index > "2018-09-18") & (df.index <= "2018-09-18")]["close"]

ts.name = market

if ('cp' in globals()) or ('cp' in locals()):

cp = pd.concat([cp, ts], axis=1, ignore_index=False)

else:

cp = pd.DataFrame(ts)

print("downloaded")


ETH/USD

Bitfinex... downloaded

Coinbase... downloaded

HitBTC... downloaded

Poloniex... downloaded

Gemini... downloaded

Kraken... downloaded

BitTrex... downloaded

Cexio... downloaded

Exmo... downloaded

Quoine... downloaded
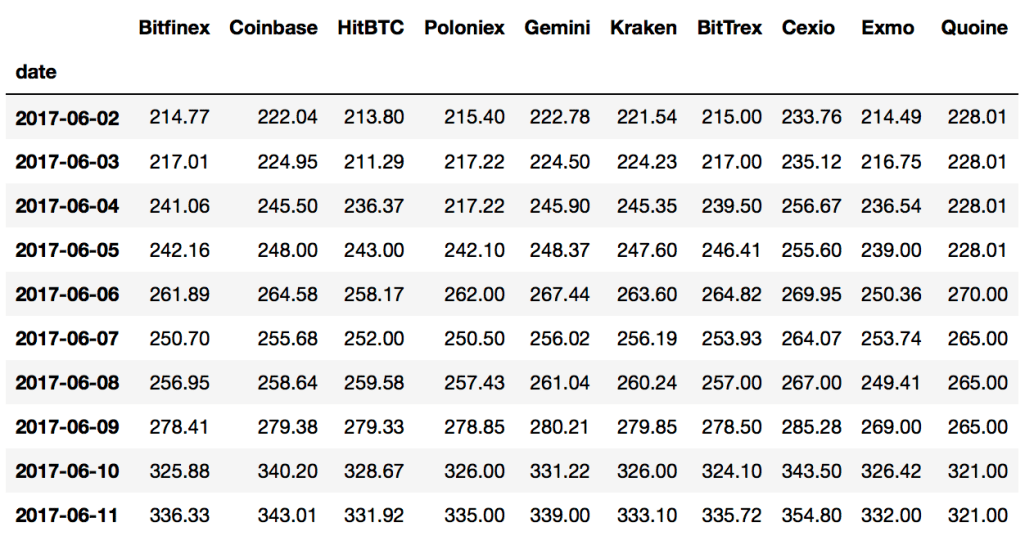
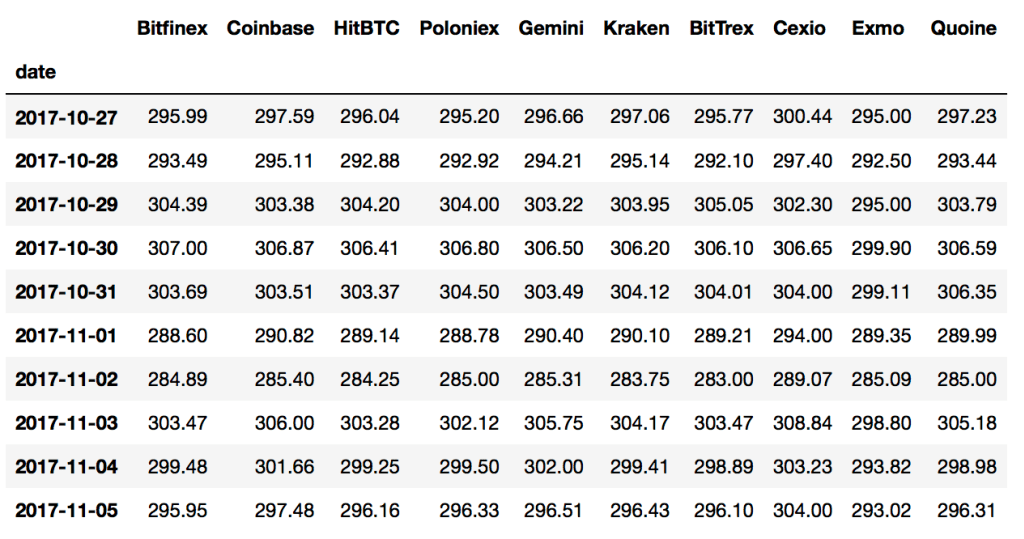
possiamo verificare le prime 10 linee del dataframe:
print(cp.head(10))

print(cp.tail(10))


Adesso abbiamo 10 registri di prezzo che vengono da 10 mercati differenti nelle nostre mani. I numeri confermano le differenze tra questi mercati alla chiusura. Adesso, vediamo come uno può scegliere un buon mercato per iniziare la strategia di arbitraggio statistico.
Stima dello spead medio per ETH/USD su mercati differenti |Arbitraggio crypto con Python
Per spread, qui non intendo la distanza tra domanda e offerta per ETH/USD. Ma piuttosto, intendo la misurazione della distanza media in USD tra i registri di prezzo e dargli una deviazione standard.
dist = []

for i in range(cp.shape[1]):

for j in range(i):

if(i != j):

x = np.array(cp.iloc[:,i], dtype=np.float32)

y = np.array(cp.iloc[:,j], dtype=np.float32)

diff = np.abs(x-y)

avg = np.mean(diff)

std = np.std(diff, ddof=1)

dist.append([cp.columns[i], cp.columns[j], avg, std])


dist = sorted(dist, key=lambda x: -x[2])

print("%10s%10s%10s%10s\n" % ("Coin1", "Coin2", "Mean", "Std Dev"))

for e in dist:

print("%10s%10s%10.5f%10.2f" % (e[0], e[1], e[2], e[3]))
Nel nostro caso il codice da i seguenti risultati:
Coin1     Coin2      Mean   Std Dev


Quoine      Exmo  31.18089     38.58

Quoine     Cexio  31.07745     37.74

Quoine  Poloniex  30.22300     40.33

Quoine  Bitfinex  30.10771     40.25

Quoine   BitTrex  30.05567     40.36

Quoine  Coinbase  29.90038     40.07

Quoine    Kraken  29.82280     40.04

Quoine    HitBTC  29.82038     39.48

Quoine    Gemini  29.71771     40.15

Cexio    HitBTC   9.88497      8.28

Cexio  Poloniex   9.68694      8.26

Exmo     Cexio   9.58420      5.15

Cexio   BitTrex   9.57796      8.27

Cexio  Bitfinex   9.56936      7.96

Cexio    Gemini   8.57503      8.20

Cexio    Kraken   8.25248      6.54

Cexio  Coinbase   7.84471      6.23

Exmo   BitTrex   6.37057      5.34

Exmo  Poloniex   6.23357      5.20

Exmo    HitBTC   6.22764      5.00

Exmo  Bitfinex   6.12720      5.01

Exmo    Gemini   6.04459      6.21

Exmo    Kraken   6.00204      4.35 *

Exmo  Coinbase   5.74370      4.20

HitBTC  Coinbase   2.77898      4.38

Gemini    HitBTC   2.77732      5.61

Kraken    HitBTC   2.63350      3.89

BitTrex    Gemini   2.51720      4.78

BitTrex    Kraken   2.48357      3.18

BitTrex  Coinbase   2.46280      3.25

Gemini  Poloniex   2.34541      5.04

Kraken  Poloniex   2.30720      3.41

Poloniex  Coinbase   2.27586      3.47

Kraken  Bitfinex   2.16834      2.73

Gemini  Bitfinex   2.16121      4.60

Coinbase  Bitfinex   2.10006      2.81

Kraken    Gemini   1.91146      5.16

BitTrex    HitBTC   1.88293      3.52

Poloniex    HitBTC   1.55051      3.61

Kraken  Coinbase   1.51592      2.52

HitBTC  Bitfinex   1.48223      3.33

BitTrex  Poloniex   1.43484      2.39

BitTrex  Bitfinex   1.23981      1.92

Gemini  Coinbase   1.23809      4.75

Poloniex  Bitfinex   0.68331      1.92
In teoria vogliamo selezionare 2 mercati con lo spread più alto e la deviazione standard più bassa. In pratica, dati i numeri qui in alto, puoi controllare tutte le combinazioni per trovare quale funziona meglio.
Strategia di trading a arbitraggio statistico per ETH/USD | Arbitraggio crypto con Python
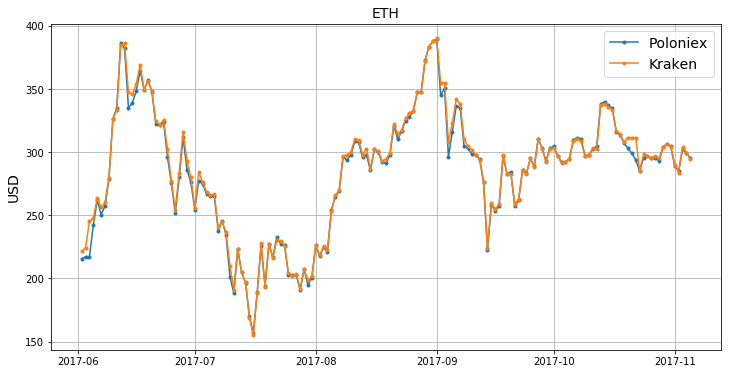
Scegliamo Exmo e Kraken come exchange. Questo significa uno spread di 6 dollari a 1σ di 4.25 dollari ci da molta speranza per una buona chiusura. Iniziamo con il download del registro di prezzi seguito da una veloce visualizzazione
market1 = "Exmo"

market2 = "Kraken"


df1 = fetchCryptoOHLC_byExchange(fsym, tsym, market1)

df2 = fetchCryptoOHLC_byExchange(fsym, tsym, market2)


# trim

df1 = df1[(df1.index > "2017-06-01") & (df1.index <= "2017-11-05")]

df2 = df2[(df2.index > "2017-06-01") & (df2.index <= "2017-11-05")]


# checkpoint

print(df1.close.shape[0], df2.close.shape[0])  # both sizes must be equal


# plotting

plt.figure(figsize=(20,10))

plt.plot(df1.close, '.-', label=market1)

plt.plot(df2.close, '.-', label=market2)

plt.legend(loc=2)

plt.title(fsym, fontsize=12)

plt.ylabel(tsym, fontsize=12)

plt.grid()
Ogni strategia di trading richiede alcune condizioni di margine.
(a) If asset1 close price (Exmo) >

asset2 close price (Kraken) then

sell asset1 short and buy asset2 long;

(b) If asset1 close price <

asset2 close price then close positions

update accounts, sell asset2 short and buy asset1 long; etc.

(c) Every time a new position is opened, invest a fixed amount of USD 2,500;

(d) After the current trade, a new one is opened immediately at the same prices;

(e) There is no slipage assumed;

(f) The short selling is available on both markets;

(g) There is no commission fee structure incorporated into trades;

(h) The margin calls are ignored.

Quindi iniziamo a vendere con 5000 dollari su Exmo e Kraken. Questo ci permetterà di monitorare il livello di cash su entrambi gli account dopo ogni trade. Il codice intero per il test è questo:
# Backtesting Stat Arb trading strategy for ETH/USD at Exmo and Kraken

#  cryptocurrency exchanges


# initial parameters

investment = 10000  # USD

account1, account2 = investment/2, investment/2  # USD

position = 0.5*(investment/2)  # USD


roi = []

ac1 = [account1]

ac2 = [account2]

money = []

pnl_exch1 = []

pnl_exch2 = []


trade = False

n = df1.close.shape[0]  # number of data points


# running the backtest

for i in range(n):

p1 = float(df1.close.iloc[i])

p2 = float(df2.close.iloc[i])

if(p1 > p2):

asset1 = "SHORT"

asset2 = "LONG"

if(trade == False):

open_p1 = p1  # open prices

open_p2 = p2

open_asset1 = asset1

open_asset2 = asset2

trade = True

print("new traded opened")

new_trade = False

elif(asset1 == open_asset1):

new_trade = False  # flag

elif(asset1 == open_asset2):

new_trade = True   # flag


elif(p2 > p1):

asset1 = "LONG"

asset2 = "SHORT"

if(trade == False):

open_p1 = p1  # open prices

open_p2 = p2

open_asset1 = asset1

open_asset2 = asset2

trade = True

print("new traded opened")

new_trade = False

elif(asset1 == open_asset1):

new_trade = False  # flag

elif(asset1 == open_asset2):

new_trade = True   # flag


if(i == 0):

print(df1.close.iloc[i], df2.close.iloc[i], \

asset1, asset2, trade, "----first trade info")

else:

if(new_trade):


# close current position

if(open_asset1 == "SHORT"):

# PnL of both trades

pnl_asset1 = open_p1/p1 - 1

pnl_asset2 = p2/open_p2 -1

pnl_exch1.append(pnl_asset1)

pnl_exch2.append(pnl_asset2)

print(open_p1, p1, open_p2, p2, open_asset1, \

open_asset2, pnl_asset1, pnl_asset2)

# update both accounts

account1 = account1 + position*pnl_asset1

account2 = account2 + position*pnl_asset2

print("accounts [USD] = ", account1, account2)

if((account1 <=0) or (account2 <=0)):

print("--trading halted")

break

# return on investment (ROI)

total = account1 + account2

roi.append(total/investment-1)

ac1.append(account1)

ac2.append(account2)

money.append(total)

print("ROI = ", roi[-1])

print("trade closed\n")

trade = False


# open a new trade

if(asset1 == "SHORT"):

open_p1 = p1

open_p2 = p2

open_asset1 = asset1

open_asset2 = asset2

else:

open_p1 = p1

open_p2 = p2

open_asset1 = asset1

open_asset2 = asset2

trade = True

print("new trade opened", asset1, asset2, \

open_p1, open_p2)


# close current position

if(open_asset1 == "LONG"):

# PnL of both trades

pnl_asset1 = p1/open_p1 -1

pnl_asset2 = open_p2/p2 - 1

pnl_exch1.append(pnl_asset1)

pnl_exch2.append(pnl_asset2)

print(open_p1, p1, open_p2, p2, open_asset1, \

open_asset2, pnl_asset1, pnl_asset2)

# update both accounts

account1 = account1 + position*pnl_asset1

account2 = account2 + position*pnl_asset2

print("accounts [USD] = ", account1, account2)

if((account1 <=0) or (account2 <=0)):

print("--trading halted")

break

# return on investment (ROI)

total = account1 + account2

roi.append(total/investment-1)

ac1.append(account1)

ac2.append(account2)

money.append(total)

trade_pnl.append(pnl_asset1+pnl_asset2)

print("ROI = ", roi[-1])

print("trade closed\n")

trade = False


# open a new trade

if(open_asset1 == "SHORT"):

open_p1 = p1

open_p2 = p2

open_asset1 = asset1

open_asset2 = asset2

else:

open_p1 = p1

open_p2 = p2

open_asset1 = asset1

open_asset2 = asset2

new_trade = False

trade = True

print("new trade opened:", asset1, asset2, \

open_p1, open_p2)


else:

print("   ",df1.close.iloc[i], df2.close.iloc[i], \

asset1, asset2)
Un registro di trading esempio che dovresti avere basato sui semplici dati selezionati comincia con:
new traded opened

214.49 221.54 LONG SHORT True ----first trade info

216.75 224.23 LONG SHORT

236.54 245.35 LONG SHORT

239.0 247.6 LONG SHORT

250.36 263.6 LONG SHORT

253.74 256.19 LONG SHORT

249.41 260.24 LONG SHORT

269.0 279.85 LONG SHORT

214.49 326.42 221.54 326.0 LONG SHORT 0.5218425101403328 -0.32042944785276073

accounts [USD] =  6304.606275350832 4198.926380368098

ROI =  0.05035326557189301

trade closed</pre>

[php]new trade opened: SHORT LONG 326.42 326.0

326.42 332.0 326.0 333.1 SHORT LONG -0.016807228915662553 0.021779141104294464

accounts [USD] =  6262.588203061676 4253.374233128834

ROI =  0.05159624361905091

trade closed

new trade opened LONG SHORT 332.0 333.1

332.0 332.0 333.1 333.1 LONG SHORT 0.0 0.0

accounts [USD] =  6262.588203061676 4253.374233128834

ROI =  0.05159624361905091

trade closed

new trade opened: LONG SHORT 332.0 333.1

332.0 390.0 333.1 385.0 LONG SHORT 0.17469879518072284 -0.1348051948051947

accounts [USD] =  6699.3351910134825 3916.3612461158473

ROI =  0.06156964371293294

trade closed

new trade opened: SHORT LONG 390.0 385.0

393.2 386.13 SHORT LONG

369.41 347.24 SHORT LONG

357.3 345.99 SHORT LONG

365.81 354.17 SHORT LONG

370.61 368.95 SHORT LONG

357.0 349.5 SHORT LONG

359.82 356.48 SHORT LONG

358.03 348.5 SHORT LONG

334.0 324.48 SHORT LONG

325.95 321.6 SHORT LONG

334.0 325.5 SHORT LONG

317.47 302.15 SHORT LONG

295.0 277.0 SHORT LONG

264.0 254.49 SHORT LONG

390.0 280.93 385.0 283.66 SHORT LONG 0.38824618232299857 -0.26322077922077913

accounts [USD] =  7669.950646820979 3258.3092980638994

ROI =  0.09282599448848772

trade closed
Nel primo trade apriamo con una lunga posizione su exmo al prezzo di 214.49 e una corta su kraken con 221.54. Dopo 8 giorni, c’è stato un nuovo segnale di trading che ha causato la chiusura di entrambe le posizioni. Il prezzo di chiusura a exmo è stato di 326.42 quindi abbiamo fatto un profitto del 52.53% fino a 326.0. Quindi di conseguenza i soldi sull’account exmo sono saliti da 5000 a 6304.61, mentre su kraken sono scesi da 5000 a 4198.93.
Poi si fa un altro trade con posizione corta su exmo e lunga su kraken etc.
Giusto per capire alcuni numeri che abbiamo preso nel test, per prima cosa guardiamo ai livelli di denaro in entrambi gli account:
plt.figure(figsize=(12,7))


plt.subplot(2,3,1)

plt.plot(ac1)

plt.title("Exmo: Cash Level")

plt.xlabel("Trade No."); plt.ylabel("USD")

plt.grid()

plt.xlim([0, len(money)])

plt.ylim([0, 14001])


plt.subplot(2,3,2)

plt.plot(ac2)

plt.title("Kraken: Cash Level")

plt.xlabel("Trade No."); plt.ylabel("USD")

plt.grid()

plt.xlim([0, len(money)])

plt.ylim([0, 14001])


plt.subplot(2,3,3)

plt.plot(np.array(money))

plt.title("Total Cash")

plt.xlabel("Trade No."); plt.ylabel("USD")

plt.grid()

plt.xlim([0, len(money)])

plt.ylim([investment, 14000])


plt.tight_layout()

plt.savefig('cashlevels.png', bbox_inches='tight')

Questi punteggi ci dicono che nella nostra strategia la performance delle vendite su Exmo sono ste migliori di quelle di kraken.
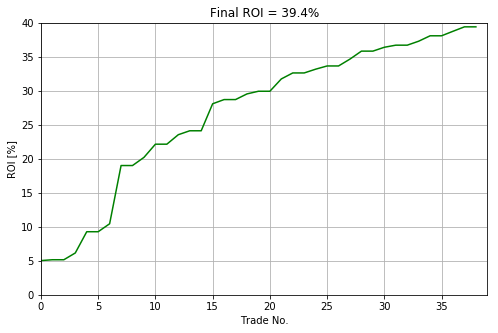
In altre parole dopo 5 mesi di utilizzo della strategia, si può finire con un ritorno del 39.4% sull’investimento iniziale di 10000 dollari.
plt.figure(figsize=(8,5))

plt.plot(np.array(roi)*100, 'g')

plt.xlabel("Trade No.");

plt.ylabel("Equity Growth [%]")

plt.title("ROI = %f.2%%" % (100*roi[-1]))

plt.xlim([0, len(money)])

plt.ylim([0, 40])

plt.grid()

plt.savefig('roi.png', bbox_inches='tight')

